First Division Cricket Stats
Photos:
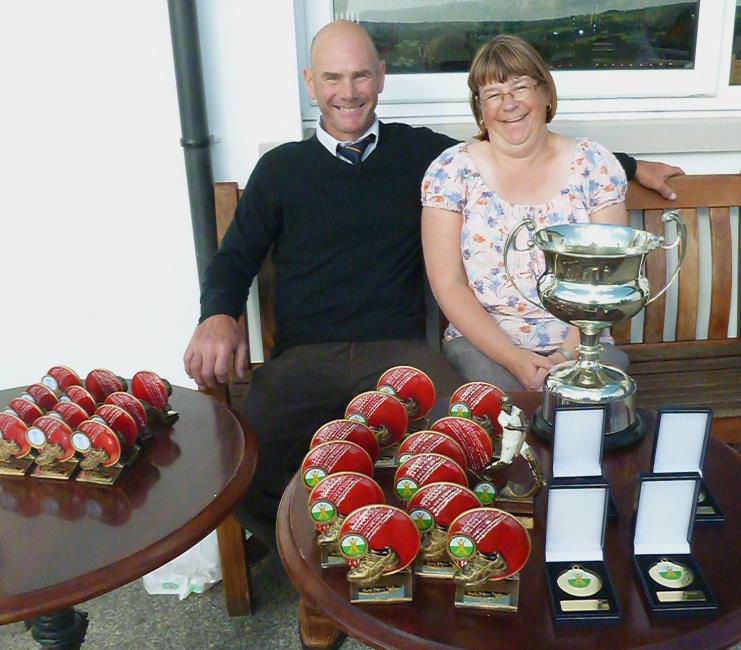
Paul and Jan Webb
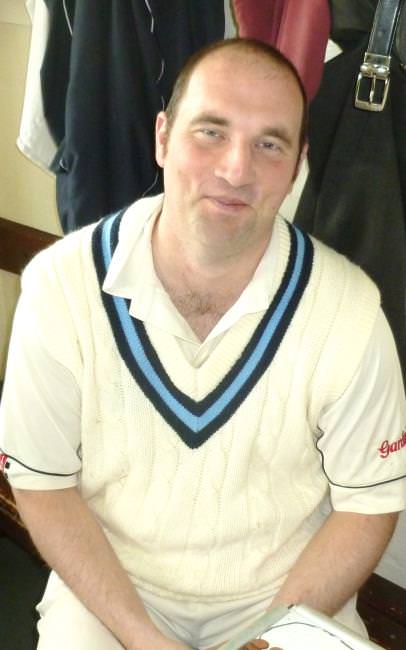
Simon Holliday (Haverfordwest)
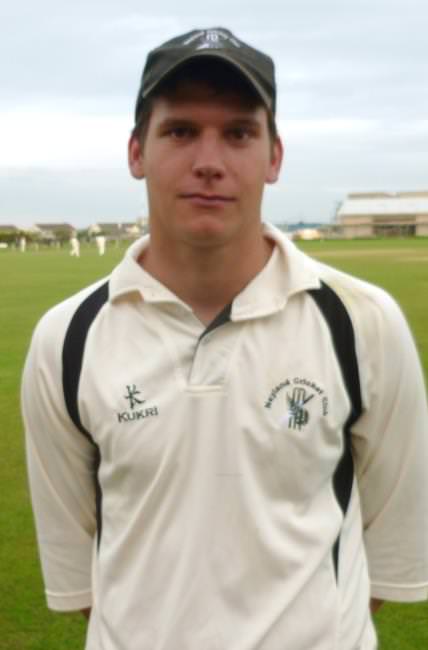
Nathan Banner (Neyland)
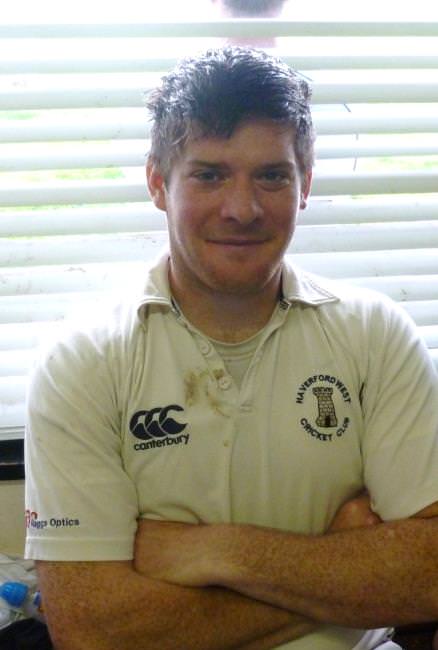
Adam James (Haverfordwest)
As usual at this season we supply the first division statistics for best batting and bowling that have been so carefully compiled by Whitland’s well-known anoraks Paul and Janice Webb, who willingly acknowledge the marvellous support from a number of ace scorers around the county.
They look at both batting and bowling from two aspects, the most runs scored and the best averages, which as usual produce slightly different stats – and another interesting angle on the game
Thanks as ever, Webbie and Jan!
What is immediately noticeable are three main points:
-
That although batsmen generally seem to have been on top because the scores are high, the runs seem to have been shared around more because the best averages are lower. (Jonathan Thomas had the best batting average of 64.10 whilst Simon Holliday amassed 661 runs.)
-
Bowlers seem to have had a little more success because Adam James grabbed 47 wickets and Nathan Banner had 35, with slow bowlers Andrew Pawlett and Andrew Miller also doing well.
-
Only three players feature in both lists, even fewer than usual, with Simon Holliday, Nick Koomen and Gareth Davies. Most people would say that Nathan Banner and Adam James would be the best all-rounders but although they top the bowling they are nowhere to be seen in the batting, despite appearing higher in their respective clubs’ order.
Now have a good read yourself and see what you make of them!
Best batting – Most Runs
|
Name |
Innings
|
Not out
|
H/S
|
50s
|
100s
|
Runs
|
|
Simon Holliday (Haverfordwest) |
17
|
6
|
67*
|
7
|
0
|
661
|
|
Peter Bradshaw (St Ishmaels) |
17
|
1
|
97
|
5
|
0
|
539
|
|
Phil Williams (Cresselly |
15
|
1
|
122*
|
1
|
1
|
512
|
|
Nick Scourfield (Carew) |
14
|
3
|
74
|
5
|
0
|
491
|
|
Nick Koomen (Neyland) |
13
|
3
|
107*
|
3
|
1
|
474
|
|
Gareth Davies (Llanrhian) |
12
|
0
|
108
|
3
|
1
|
457
|
|
Jonathan Thomas (Whitland) |
11
|
4
|
111
|
1
|
2
|
448
|
|
Ashley Sutton (Neyland) |
14
|
3
|
107*
|
1
|
1
|
434
|
|
Simon Cole (Cresselly) |
14
|
2
|
66
|
2
|
0
|
431
|
|
Jack Jones (Llanrhian) |
16
|
5
|
85
|
1
|
0
|
420
|
|
Dan Howells (St Ishmaels) |
18
|
2
|
93
|
2
|
0
|
418
|
|
Marc Hughes (Narberth) |
15
|
0
|
70
|
2
|
0
|
398
|
|
Brad McDermott-Jenkins (Cresselly) |
13
|
4
|
90
|
5
|
0
|
396
|
|
Andrew Cole (Lawrenny) |
16
|
0
|
70
|
1
|
0
|
395
|
|
Matthew Morgan (Cresselly) |
16
|
2
|
75
|
3
|
0
|
382
|
|
Steve Lewis (Lawrenny) |
15
|
11
|
80
|
4
|
0
|
380
|
|
Paul Davies (Whitland) |
14
|
1
|
100*
|
0
|
1
|
375
|
|
Phil Cockburn (St Ishmaels) |
15
|
4
|
64*
|
2
|
0
|
353
|
|
Ian Sefton (Carew) |
8
|
2
|
94
|
3
|
0
|
334
|
|
Simon Wood (Carew) |
11
|
2
|
70*
|
2
|
0
|
333
|
Best batting – Top averages
|
Name |
Runs
|
Innings
|
Not out
|
Average
|
|
Jonathan Thomas (Whitland) |
448
|
11
|
4
|
64.10
|
|
Simon Holliday (Haverfordwest) |
661
|
17
|
6
|
60.09
|
|
Ian Sefton (Carew) |
334
|
8
|
2
|
55.66
|
|
Nick Koomen (Neyland) |
474
|
13
|
3
|
47.40
|
|
Nick Scourfield (Carew) |
491
|
14
|
3
|
44.63
|
|
Brad McDermott-Jenkins (Cresselly) |
396
|
13
|
4
|
44.10
|
|
Ashley Sutton (Neyland) |
434
|
14
|
3
|
39.45
|
|
Jack Jones (Llanrhian) |
420
|
16
|
5
|
38.18
|
|
Gareth Davies (Llanrhian) |
457
|
12
|
0
|
38.08
|
|
Simon Wood (Carew) |
333
|
11
|
2
|
37.00
|
|
Phil Williams (Cresselly) |
512
|
15
|
1
|
36.57
|
|
Simon Cole (Cresselly) |
431
|
14
|
2
|
35.91
|
|
Peter Bradshaw (St Ishmaels) |
539
|
17
|
1
|
33.68
|
|
Phil Cockburn (St Ishmaels) |
353
|
15
|
4
|
32.09
|
|
Paul Davies (Whitland) |
375
|
14
|
1
|
28.84
|
|
Matthew Morgan (Cresselly) |
382
|
16
|
2
|
27.28
|
|
Steve Lewis (Lawrenny) |
380
|
15
|
1
|
27.14
|
|
Marc Hughes (Narberth) |
398
|
15
|
0
|
26.53
|
|
Dan Howells (St Ishmaels) |
418
|
18
|
2
|
26.12
|
|
Andrew Cole (Lawrenny) |
395
|
16
|
0
|
24.68
|
Top Bowlers – Best Averages
|
Name |
Overs
|
Maidens
|
Runs
|
Wickets
|
Best
|
Average
|
|
Nathan Banner (Neyland) |
149.2
|
41
|
394
|
35
|
5-9
|
11.25
|
|
Adam James (Haverfordwest) |
156.3
|
30
|
587
|
47
|
6-14
|
12.48
|
|
Andrew Miller (Neyland) |
93.0
|
6
|
316
|
25
|
5-30
|
12.64
|
|
Simon Holliday (Haverfordwest) |
73.1
|
6
|
304
|
24
|
5-13
|
12.66
|
|
Nick Koomen (Neyland) |
84.5
|
20
|
285
|
22
|
4-22
|
12.95
|
|
Henry Durrant (Neyland) |
125.1
|
31
|
355
|
27
|
5-6
|
13.14
|
|
Andrew Pawlett (St Ishmaels) |
138.3
|
18
|
433
|
31
|
5-69
|
13.96
|
|
Tom Murphy (Cresselly) |
123.5
|
18
|
438
|
28
|
5-14
|
15.64
|
|
Gareth Davies (Llanrhian) |
113.1
|
18
|
378
|
24
|
6-20
|
15.75
|
|
Mark Lee (Whitland) |
142.1
|
35
|
425
|
23
|
4-32
|
18.47
|
|
Clive Tucker (Haverfordwest) |
132.4
|
25
|
508
|
27
|
4-21
|
18.81
|
|
Dan James (Whitland) |
150.0
|
23
|
544
|
28
|
7-38
|
19.42
|
|
Rob Williams (Lawrenny) |
151.1
|
26
|
478
|
24
|
5-23
|
19.91
|
|
Tom Davies (Carew) |
91.5
|
15
|
399
|
20
|
7-33
|
19.95
|
|
Ian Hughes (Narberth) |
142.4
|
38
|
462
|
23
|
4-49
|
20.08
|
|
Andrew Williams (St Ishmaels) |
129.5
|
12
|
514
|
25
|
4.35
|
20.56
|
|
Stefan Jenkins (Cresselly) |
119.0
|
13
|
554
|
26
|
7-27
|
21.30
|
|
Rhys Davies (Carew) |
143.5
|
21
|
521
|
22
|
5-25
|
23.68
|
|
Luke Jones (Llanrhian) |
161.3
|
27
|
602
|
25
|
4-27
|
24.08
|
|
Matthew Bennett (Llanrhian) |
162.3
|
31
|
603
|
22
|
3-42
|
27.40
|
Best Bowlers – Most Wickets
|
Name |
Overs
|
Maidens
|
Runs
|
Average
|
Wickets
|
|
Adam James (Haverfordwest) |
156.3
|
30
|
587
|
12.48
|
47
|
|
Nathan Banner (Neyland) |
149.2
|
41
|
394
|
11.25
|
35
|
|
Andrew Pawlett (St Ishmaels) |
138.3
|
18
|
433
|
13.96
|
31
|
|
Dan James (Whitland) |
150
|
23
|
544
|
19.42
|
28
|
|
Tom Murphy (Cresselly |
123.5
|
18
|
438
|
15.64
|
28
|
|
Henry Durrant (Neyland) |
125.1
|
31
|
355
|
13.14
|
27
|
|
Clive Tucker (Haverfordwest |
132.4
|
25
|
508
|
18.81
|
27
|
|
Stefan Jenkins (Cresselly) |
119
|
13
|
554
|
21.30
|
26
|
|
Andrew Williams (St Ishmaels) |
129.5
|
12
|
514
|
20.56
|
25
|
|
Andrew Miller (Neyland) |
93
|
6
|
316
|
12.64
|
25
|
|
Luke Jones (Llanrhian) |
161.3
|
27
|
602
|
24.08
|
25
|
|
Simon Holliday (Haverfordwest) |
73.1
|
6
|
304
|
12.66
|
24
|
|
Rob Williams (Lawrenny) |
151.1
|
26
|
478
|
19.91
|
24
|
|
Gareth Davies (Llanrhian) |
113.1
|
18
|
378
|
15.75
|
24
|
|
Ian Hughes (Narberth) |
142.4
|
38
|
462
|
20.08
|
23
|
|
Mark Lee (Whitland) |
132.1
|
35
|
425
|
18.47
|
23
|
|
Rhys Davies (Carew) |
143.5
|
21
|
521
|
23.68
|
22
|
|
Matthew Bennett (Llanrhian) |
162.3
|
31
|
603
|
27.40
|
22
|
|
Nick Koomen (Neyland) |
84.5
|
20
|
285
|
12.95
|
22
|
|
Tom Davies (Carew) |
91.5
|
15
|
399
|
19.95
|
20
|